 | |
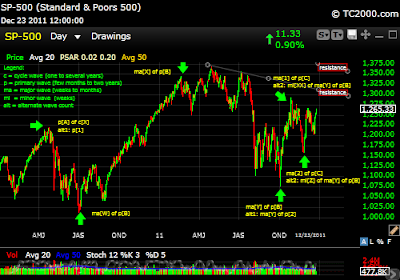
| Two week chart of S&P500, click to enlarge |
The previous blog update on September 14th labeled the move down from the May top as major wave Y of primary wave B(nearing completion) with a 1st price target for primary wave C near the July highs.
Major wave Y bottomed about 3 weeks later on October 4th with just a one day close below the August low. The subsequent primary wave C 1st wave then blasted up toward that 1st price target but did not quite reach it.
As mentioned previously in the blog and Twitter updates, Primary wave C should be either an impulse or ending diagonal in order to complete a zigzag from the March/2009 lows. As shown in the chart, major wave 1 of primary wave C ended at the October 27th high, major wave 2 ended at the November low and major wave 3 is now in progress. The waves thus far have been mostly three wave structures which indicates primary wave C is forming an ending diagonal, not an impulse.
An alternate count shown has major wave Y of primary wave B ending at the November low. That count would have the same outlook as the preferred count from the bottom of major wave Y. Another possibility is that a triangle ended at the December low, and that would also have the same outlook.
The price resistance shown and also mentioned in the tweets is at 1298 to 1310 and around the May high. Perhaps major wave 3 will top in that 1st price zone and major wave 5 in the 2nd price zone. I am looking for that wave 5 top to occur by late March at the latest and mid January at the earliest.


